Time Varying Signals
In this lab, we examine the output voltage (v_out) with regard to the input voltage (v_in). The input voltage comes in the form of sinusoidal, triangle, and square waves. The two resistors are given to have the same value, 6.8 kΩ.
If we apply voltage division, we find that the output voltage is just half of the input voltage as shown on the bottom of the whiteboard. Therefore, the output voltage will have the same shape and period of the input voltage but the amplitude will simply be half.
Sinusoidal Wave
 |
| Input: V = 2V, f = 1kHz, T = 0.5 ms |
 |
| Output: V = 1V, f = 1kHz, T = 0.5 ms |
Triangle Wave
 |
| Input: V = 2V, f = 1kHz, T = 0.5 ms |
 |
| Output: V = 1V, f = 1kHz, T = 0.5 ms |
Square Wave
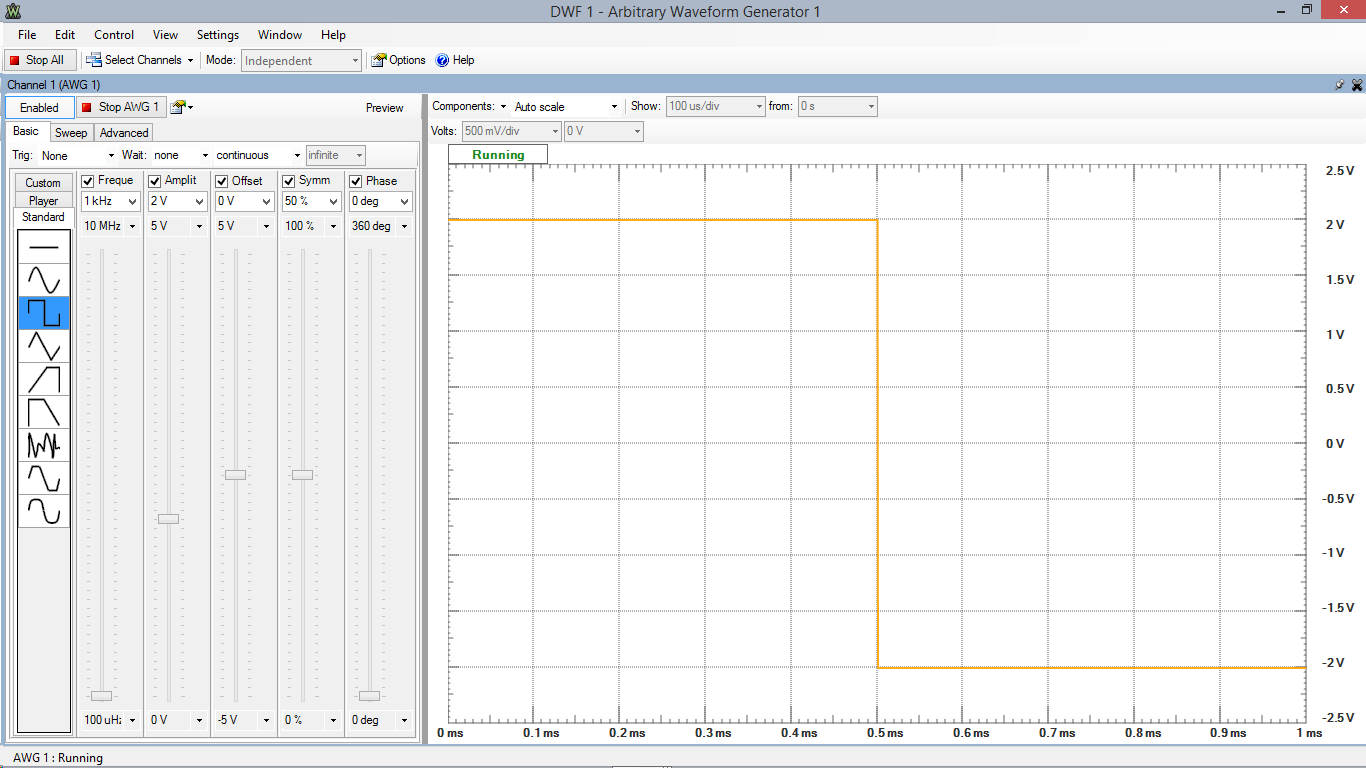
 |
| Input: V = 2V, f = 1kHz, T = 0.5 ms |
 |
| Output: V = 1V, f = 1kHz, T = 0.5 ms |
A BJT Curve Tracer

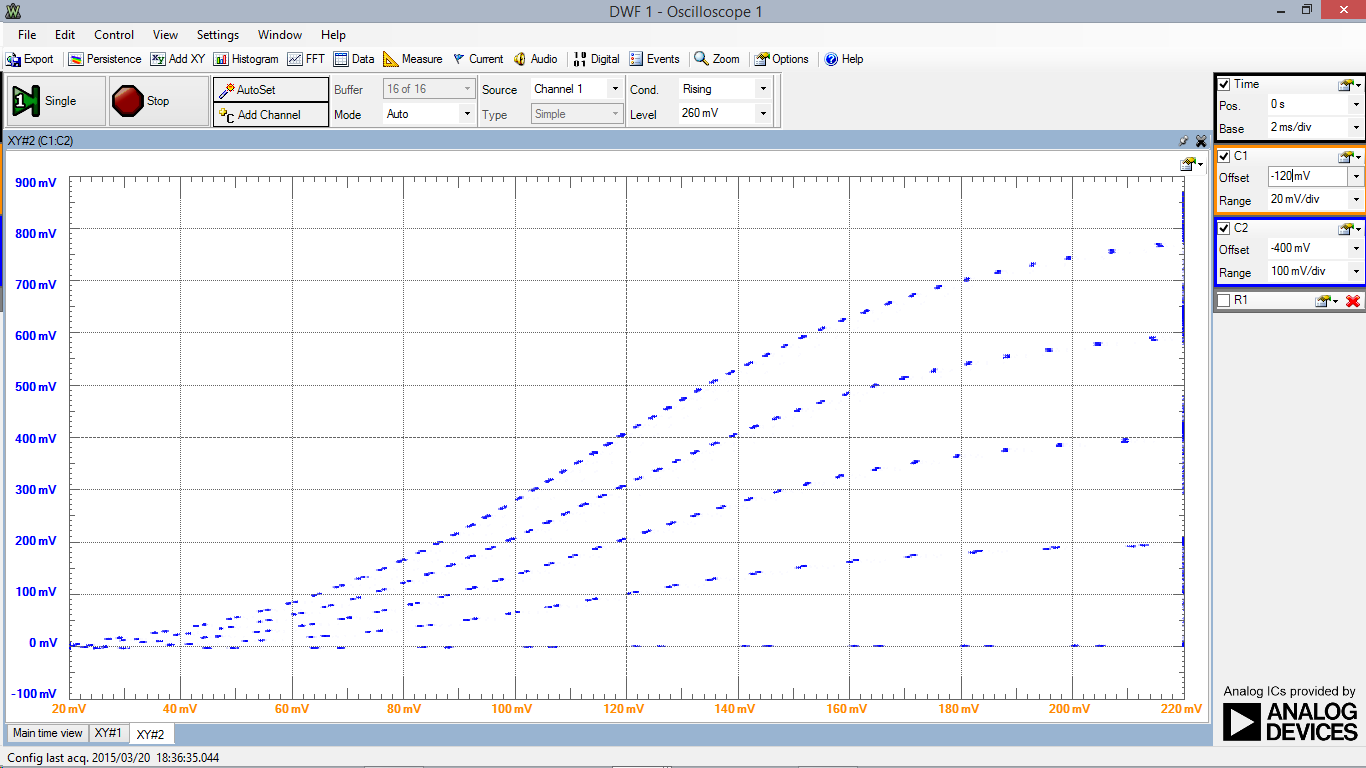
We set a triangle wave on channel 1 (W1) with a frequency of 200 Hz, amplitude of 2.5 V, offset of 2.5 V and phase angle of 270 degrees. This gives us a wave that starts at zero, has an amplitude of 5 V and has a period of 5 ms. We then created a stepped wave that starts at 0 V and rises by 1 V increments every 5 ms for 25 ms (period is 25 ms). This wave has a frequency of 40 Hz, 2 V amplitude, and 2.6 V offset.
If we compare the period of the two waves, we can see that the triangle wave completes one period (5 ms) for every step the stepped wave takes, completing 5 periods for every 1 period of the stepped waveform.
We now graph collector current I_c vs collector-emitter voltage, V_ce to obtain the graph above. We see there is five regions which correspond to the five voltages of the stepped waveform. We can see that there is a linear region between the transistor's threshold and saturation voltages.


No comments:
Post a Comment