Friday, March 27, 2015

Inverting Voltage Amplifier

Inverting Voltage Amplifier


In this lab, we wire the circuit above using an inverting voltage amplifier, OP27. We design the circuit in a way that the output is fed back in to the -in through a resistor double that of the -in resistor. We used 3.6 kΩ and 1.8 kΩ resistors which were measured at 3.51 kΩ and 1.76 kΩ, respectively.
The inverting voltage amplifier works according to the equation V_out = - (R2/R1)*V_in. Since R2 is double that of R1, this equation reduces to V_out = -2*V_in.


We use the data sheet from Analog Devices manufacturer to find the pin configuration diagram and wire the circuit accordingly. We use Analog Discovery to provide the 5+, 5-, and V_in supplies. Using a multimeter, we measure the output voltage, V_out and record the values. The input voltage is varied from -3.0 V to 4.0 V in 0.5 V increments. The data is shown below.


 Plotting output voltage vs input voltage we obtain the graph above. We see that there are saturation regions at -2.5 V and +2.5 V. In the center there is a linear region whose slope -1.97. If we rearrange the equation mentioned earlier, V_out = -2*V_in becomes V_out/V_in = -2 which is basically what the linear region in this graph represents (this is the gain). We obtained -1.97 instead of 2, which gives us a % error of  1.5%. The saturation regions are also of interest. We see that saturation occurs at +/- 2.5 V. When these voltages are doubles, we get +/- 5V which correspond to the +V and -V applied (+/- 5 V).

Tuesday, March 24, 2015

Non-Ideal Power Sources, Maximum Power Transfer

Non-Ideal Power Sources

When modeling circuits, ideal power sources are often used for simplicity. However, power sources actually have an internal source resistance which can be measured. In this experiment, we use a method to show that an internal resistance of a power sources exist.

We use the diagram above to model our circuit. The yellow portion indicates the voltage source V_s with its internal source resistance R_s. A resistor, R = 22 Ω, is wired in series so that we can measure the output voltage V_out across it. A source voltage of V_s = 1 V is used. The source current, I_s, and power dissipated by resistor R can be calculated.

First, we consider an ideal power source V_s (in red). This means we consider the circuit without R_s. It is apparent that the output voltage is simply the source voltage, 1 V. Using Ohm's Law, the source current can be calculated, I_s = 45.5 mA. The power can now be easily obtained by multiplying the current and voltage, P = 45.5 mW.
Next, we consider the non-ideal power source (in blue). Using a voltage divider, we find the output voltage to be V_out = R(1 V) / (R + R_s), which for the resistor chosen yields 22 / (22 + R_s).
The source current is then calculated as I_s = 1 / (R + R_s). The power then can easily be calculated, giving us P = R / (R + R_s)^2. All of these are functions of R_s and R (which we will vary 3 times in this experiment).

Measuring V_out (22.4 Ω) = .976 V
The source is provided by Analog Discovery interface using WaveForms. We apply a source voltage of 997 mV which gives us a reading of 1.000 V on the multimeter. We then apply this voltage to a resistor R which is varied.


The chart shows the output voltages (V_out) measured for the three measured resistor (R) values. The three calculated columns show the source resistance (R_s), source current (I_s) and power through resistor R (P_R). All values are in standard units (V, Ω, A, and W). There is a source resistance of about 0.43 Ω (average). The power dissipated by the resistor R then an average of 0.0296 W.

Saturday, March 21, 2015

Thevenin's Theorem

Thevenin's Theorem

In this lab we use the are given the circuit above with two independent sources (5 V and 2 V) and 6 resistors along with a variable load resistor R_L. Thevenin's theorem makes it possible to create an equivalent circuit consisting of an equivalent voltage source V_th in series with an equivalent resistor R_th. The load, R_L can be changed many times and calculations become simpler.
We first begin by finding the equivalent Thevenin resistance, R_th (calculation in purple). We remove all independent voltage sources (shorting them), remove the load resistor R_L, and measure the resistance from nodes a and b. We obtain an equivalent resistance of R_th = 7.1986 kΩ.


We now calculate for the open circuit voltage across nodes a and b (calculation in red). The open circuit voltage is the Thevenin equivalent voltage, V_th. This time we factor in the voltage sources but leave the load resistor out (R_L). We use mesh analysis to find our two mesh currents i_1 and i_2. There is no current flowing through the 1 kΩ and 1.3 kΩ resistors because a-b is an open circuit. Using the mesh currents found, we calculate the voltage drops across the 4.7 kΩ and 6.8 kΩ resistors. The sum of these voltage drops equals the voltage drop from a to b which is V_th. V_th = V_4.7 + V_6.8 = -2.04 + 2.50 = 0.45 V.


We wire the circuit without the voltage sources and measure the Thevanin equivalent resistance, R_th = 7.17 kΩ (0.4% error).

We add the voltage supplies and measure the voltage drops across the 4.7 kΩ and 6.8 kΩ resistors. The sum of of these voltage drops is our equivalent Thevanin voltage. V_th = 2.48 - 2.02 = 0.46 V (2.2% error).


We now apply a load resistor R_L of 1 kΩ (0.994 kΩ measured) and 6.8 kΩ (6.63 kΩ measured) resistances, one at a time. We then measure the load voltage drops V_L across these resistors.

First we apply the 1 kΩ resistor and measure a V_L of 54.4 mV (55.9 mV theoretical, 2.7% error). We then apply the 6.8 kΩ resistor and measure a V_L of 214 mV (225 mV theoretical, 4.9% error).
The calculated results were closely to their corresponding theoretical results.


We now diagram our Thevanin equivalent circuit with its equivalent voltage source V_th = 0.458 and equivalent Thevanin resistance R_th = 7.1986 kΩ. Providing the 458 mV source is not a problem using WaveForms. However, finding a 7.20 kΩ resistor is a challenge and ordering one can be costly. Instead, we use a 10k potentiometer and set it to have a resistance of 7.20 kΩ. We now wire the circuit with 458 mV source (red probe), potentiometer as the Thevalin resistor, load resistor R_L connected to ground (black probe).

We now measure the load voltages across the 1 kΩ (left) and 6.8 kΩ (right) resistors. We obtain load voltages for the 1 kΩ and 6.8 kΩ resistors of V_L(1kΩ) = 54 mV (55.8 mV theoretical, 3.2% error) and V_L(6.8 kΩ) = 216 mV (225 mV theoretical, 4.0% error).


If we wanted to repeat the calculations for many load resistances, it is convenient to use another potentiometer. We used a 10k potentiometer (9.2k measured) in place of the load resistor. We then used two multimeters to measure the load resistance and load voltage simultaneously. However, we measure the resistance 'on the other side' of the pot. In this case, we need to subtract the measured resistance from the pot resistance from side to side. So we subtract the multimeter reading from 9.2 kΩ to obtain the load resistance provided by the potentiometer.


We obtain the following data where the first two columns are the readings from the multimeter. The R_adjusted column is 9.2 kΩ - R_meter. Power is just calculated as (V_meter)^2/R_adjusted. Units (not shown in data) are in V, kΩ, kΩ, and mW across the columns from left to right.


We now can plot a graph for power vs. resistance. We can see that the power increases as the load resistance increases until it reaches a maximum and then starts to fall a bit. The maximum is 6.97 mW, which occurs when our load resistance is 7.26 kΩ. This corresponds closely to our Thevenin resistance of 7.20 kΩ. Maximum power will occur when the load resistance is equal to Thevenin resistance.

Friday, March 20, 2015

Time Varying Signals, BJT Curve Tracer

Time Varying Signals


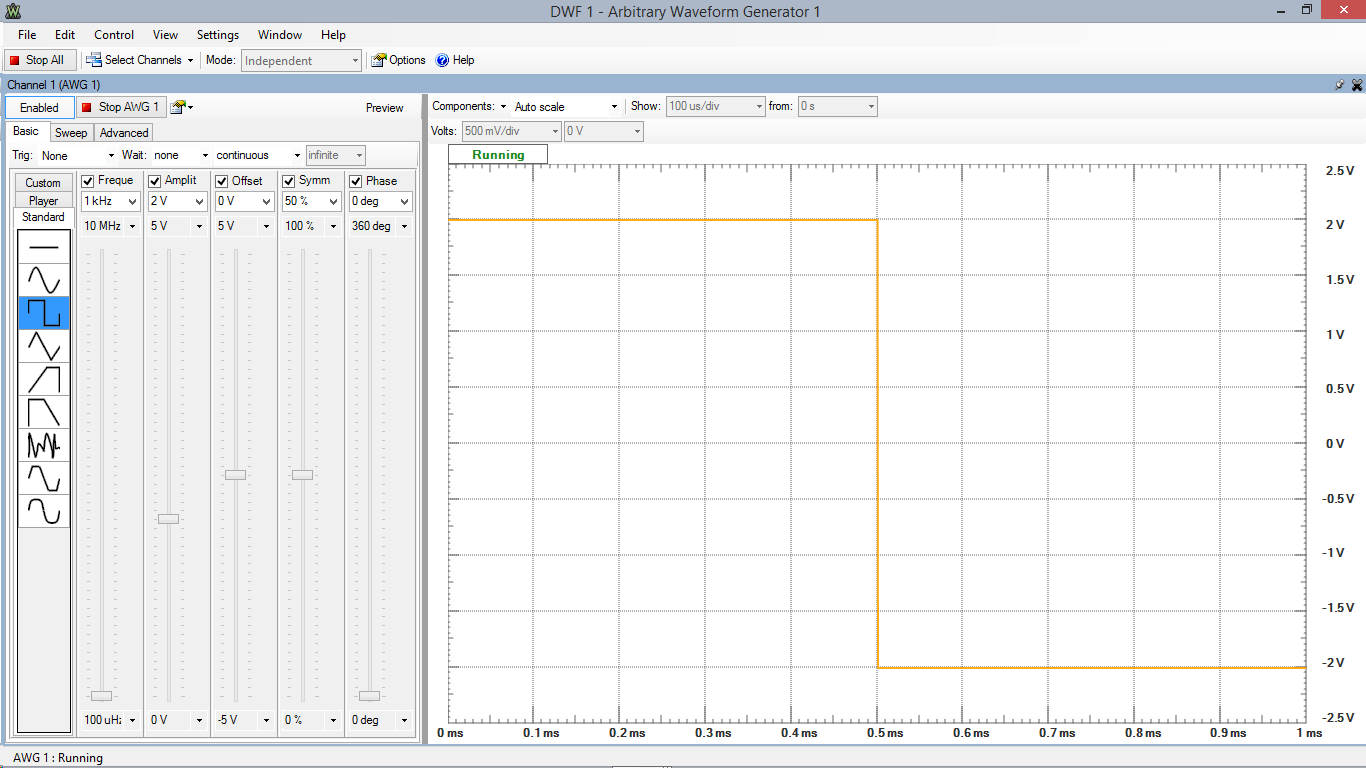
In this lab, we examine the output voltage (v_out) with regard to the input voltage (v_in). The input voltage comes in the form of sinusoidal, triangle, and square waves. The two resistors are given to have the same value, 6.8 kΩ.


If we apply voltage division, we find that the output voltage is just half of the input voltage as shown on the bottom of the whiteboard. Therefore, the output voltage will have the same shape and period of the input voltage but the amplitude will simply be half.

We wired the circuit and connected Analog Discovery to provide the arbitrary waveform generator via WaveForms. We measured the resistors to be 6.67 kΩ and 6.66 kΩ, respectively. The input voltage was 2V in all cases, and an oscilloscope tool on the interface was used to measure the output voltage.

Sinusoidal Wave
Input: V = 2V, = 1kHz, T = 0.5 ms
Output: V = 1V, 1kHz, T = 0.5 ms


Triangle Wave
Input: V = 2V, 1kHz, T = 0.5 ms
Output: V = 1V, 1kHz, T = 0.5 ms

Square Wave
Input: V = 2V, 1kHz, T = 0.5 ms
Output: V = 1V, 1kHz, T = 0.5 ms
Our hypothesis was correct, the output voltages were just half (1V) of the input voltages (2V). For all three types of waves, the frequencies (1kHz) and periods (0.5 ms) remained the same.

Sunday, March 15, 2015

Mesh Analysis

Mesh Analysis


In this lab, we are given the circuit above and asked to find the current I1 through the 1.5 kΩ resistor and the potential difference V1 through the 20 kΩ resistor. We will first find the theoretical value, then build the circuit to obtain measured values.

Since we do not have all the resistors at our disposal, we swap the 1.5 kΩ resistor with a 1.8 kΩ resistor and the 20 kΩ resistor with a 22 kΩ one. We then measure the actual resistances of the resistors. The measured resistances correspond to the resistors of closest theoretical resistance (e.g. the measured 1.77 kΩ corresponds to the theoretical 1.8 kΩ resistor). Next mesh currents i1, i2, and i3 are drawn at each independent loop and are all given a clockwise sense. Three equations are obtained and simplified. These equations are solved using matrices using a calculator to give us the three mesh currents circled.


We now wire the circuit and provide the voltage sources using WaveForms and Analog Discovery. The red wire, red grabber provides the 5 V. The yellow wire, red grabber provides 2 V. And the black wire, black grabber is ground.


The resistors are set up on the breadboard in a manner that somewhat resembles the diagram. The top resistor is 1.8 kΩ, the next row of resistors are 4.7 kΩ and 6.8 kΩ from left to right, and the resistor at the far right crossing the center channel is the 22 kΩ one.

We use a digital multimeter to measure the current through the 1.8 kΩ resistor (i1) and the voltage drop across the 22 kΩ resistor (V1). Our measurements are i1 = -0.332 mA and V1 = 2.4 V.
Percent errors were 2.6% for V1 and 27% for i1.

The percent error in current 1 is way too high to be acceptable.


We revise our calculations. Using the actual resistances measured, we calculate the three mesh currents again. We find that the voltage has a 3.0% error and the current has 24% error, The DMM has a reading error of 1.5% max per user manual (http://manuals.harborfreight.com/manuals/37000-37999/37772.pdf). This still leaves us with an incredibly high percent error for current. It would be best to repeat the experiment to examine in greater depth where the sources of error may have come from.

Tuesday, March 10, 2015

Nodal Analysis

Nodal Analysis


In this lab, we use nodal analysis to determine the voltages across the 22 kΩ and 6.8 kΩ resistors (V_1 and V_2).


We set our reference node at the bottom and use nodal analysis at node B to obtain the first equation (EQ. 1). The assumed current directions are drawn with arrows but not labeled since it is not absolutely necessary. We then obtain three more equations (EQ. 2 - EQ. 4) using nodal analysis. Obtaining the last three equations is simple since the voltage sources are all between the reference node and the remaining nodal voltages to be found. The nodal voltages are just that of the voltage source.
Putting the equations into a matrix, we can solve for the individual nodal voltages. Substitution might have been easier in this case but since we are learning matrices, we chose the matrix method. We then used these nodal voltages to find the voltages across the resistors V_1 and V_2.
We got V_1 = 2.42 V and V_2 = 4.42 V.


Now we wired up the circuit so we can find our experimental values. The three resistors are 6.8 kΩ, 22 kΩ, and 10 kΩ (from left to right). However, the actual measured values for these resistors were 6.66 kΩ, 9.88 kΩ, and 21.8 kΩ (from left to right). The voltage sources were provided by WaveForms with Analog Discovery. The voltages delivered are -3V, -5V, and 5V, from left to right (the red, black, and red leads).


We measured V_1 = 2.41 V and V_2 = 4.38 V. This is pretty close to our original theoretical values. Substituting the values measured for the resistors into the first nodal analysis equation (EQ. 1) and solving for the voltage at node B, we get V_B = -0.5856 V. Now solving again for V_1 and V_2 we get 2.41 V and 4.41 V, respectively.
V_1 has an experimental error of 0.0% and V_2 has an error of 0.7%. We feel very confident about our values.

FreeMat

Solving Simultaneous Equations with FreeMat

Here we use FreeMat to solve a system of equations that arise from using KVL and KCL on the circuit above. It is given that V1 = 15V , V2 = 7V , R1 = 20Ω , R2 = 5Ω, R3=10Ω. We are looking for the current through R3.
Let node A be the node at the top, over the R3 resistor. We choose currents I1 and I2 at the top and pointing to the left, that is I1 is coming out of node A and I2 is coming into the node. I3 is chosen to go through R3 and points up, going into node A. KCL gives us the equation I1 - I2 + I3. Using KVL at the two independent loops, we obtain two equations: 15 + 20I1 + 10I3 = 0 and 7 - 10I3 + 5I2 = 0. Using the KCL equation, we can write the KVL equations in terms of only two currents I2 and I3. We get 20I2 + 30I3 = -15 and 5I2 -10I3 = -7.

Using FreeMat, we can set the resistances in a matrix R and the voltages in a matrix V. Now we can perform matrix multiplication, multiplying the inverse of matrix R with matrix V to find the current matrix I: I = inv(R)*V. This gives us our current vector I = [I2 , I3] = [-1.0286,0.1857]. So the current through the R3 resistor is I3 = 0.1857 Ω in the direction pointing up towards node A.


Plotting Exponentials


Here we plot the graphs of output vs. time of two circuits, Circuit A and Circuit B. The output is given as 2*exp(-t/τ). The time constants for Circuit A and Circuit B are τ = 100 ms and τ = 200 ms, respectively. We need to find which circuit will reach the lowest output soonest.

First the time vector, t, was set using the linspace command. A start point of 0 and endpoint of 1 was chosen (in seconds) with a 1000 points in between. Next the time constant variables tau1 and tau2 were created. The output vectors for each circuit were created (circuitA and circuitB) using the output equation given. Next the plot command was used along with the legend command to help distinguish the two curves.
We see that the blue curve reaches the lowest output first. From the legend, the blue curve represents the circuit with the 100 ms time constant, Circuit A. Next time a more appropriate name such as Circuit A will be given for clarity.

We now plot the ouput vs. time graphs for the same circuits, using the same time constants. This time however the output equation has changed to 2*(1-exp(-t/τ)).

The time constant variables remained unchanged, only the circuit variables were updated (circuitA, circuitB). The plot was created the same was as the first time. This time, the legend was improved as planned, and axis labels were created.
We can see that the output of Circuit A reaches 2 faster than Circuit B.


Thursday, March 5, 2015

Temperature Measurement System

Fiesta Problem


Instead of using KCL and KVL to find the voltages with respect to currents or vice versa, we used nodal analysis. This way, we end up with a system of 2 equations with w unknowns instead of a system of 3 equations with 3 unknowns. The reference node was given at the bottom. We then used KCL at nodes 1 and 2. We end up with two equations which, if the resistances and currents are given, can be solved for both voltages 1 and 2.